
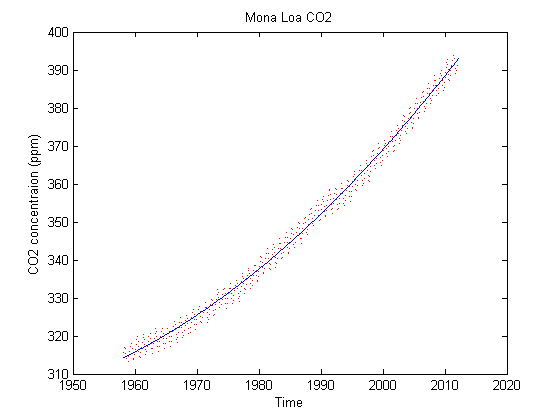
The time series of carbon dioxide measured at Hawaii’s Mona Loa observatory under the direction of Dr. Charles David Keeling is widely recognized as a seminal component of our scientific understanding of anthropogenic global warming. Often called the “Keeling Curve”, this time series shows measured carbon dioxide concentrations at Mona Loa from the 1950’s to the present day, and profoundly illustrates the rapid rise in carbon dioxide over the past half-century.
While the secular increasing trend is clear, there is also higher frequency variability in the Keeling Curve that is less obvious to the naked eye when the substantial trend is left in the data.
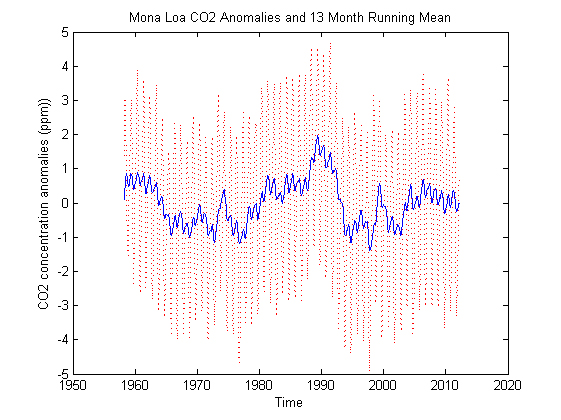
Removing the secular trend, removing the resulting time series mean, and filtering the carbon dioxide record allows for an analysis of the variability in carbon dioxide anomalies. This analysis illustrates both strong seasonal variability as well as subtle multi-decadal variability in carbon dioxide levels which are likely caused by natural climate system variability superimposed on the strong anthropogenic signal.
