
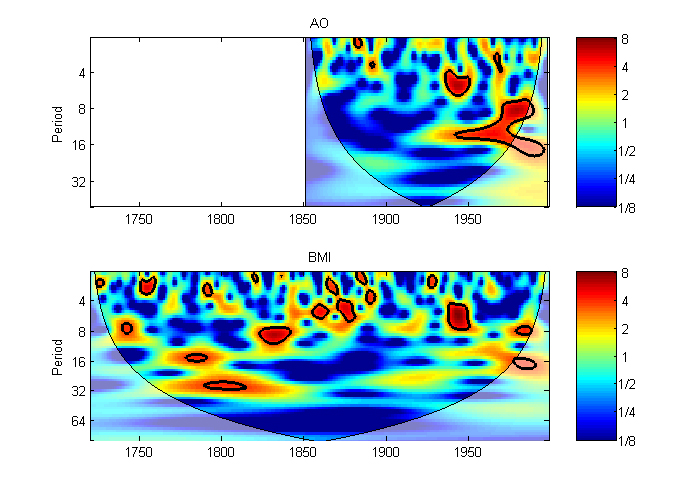
Wavelet scalograms allow for the analysis of time series in both time and frequency space simultaneously. This allows for the quick discerning of strong frequencies in a time series which are actually large singular or non-regularly repeating events. The above two wavelet scalograms illustrate significant spectral power surrounded by black curves within NOAA’s Arctic Oscillation index and Baltic maximum sea ice extent. Spectral power is expressed by the color gradient, while time increases along the abscissa from the origin and period decrease along the ordinate from the origin. Areas bounded by black curves represent significant frequencies at the 95% level.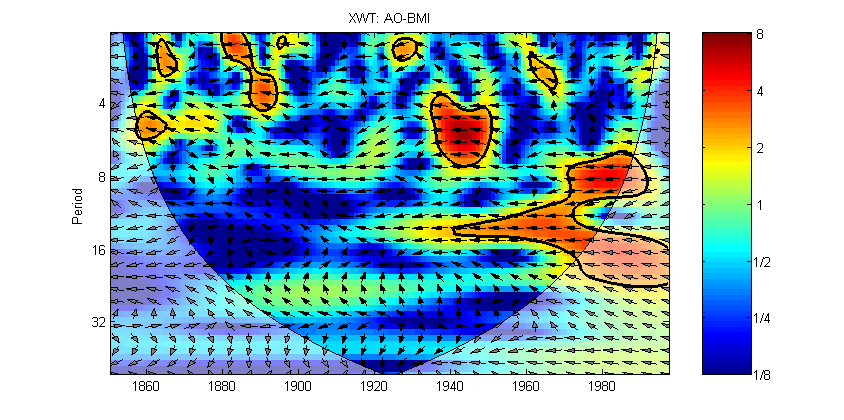
In order to more deeply analyze the relationships between periodic components of these time series, we can calculate their cross-wavelet transformation and plot as a single scalogram. In this scalogram, the color grade, abscissa, and ordinate remain the same as in the separate wavelet scalograms, however, now frequencies with coincident high-spectral power between each time series are shown. Whether those strong periodic components are in or out of phase is shown by the direction of the superimposed arrows, which indicate anti-phase conditions when pointing left, and in-phase conditions when pointing right.
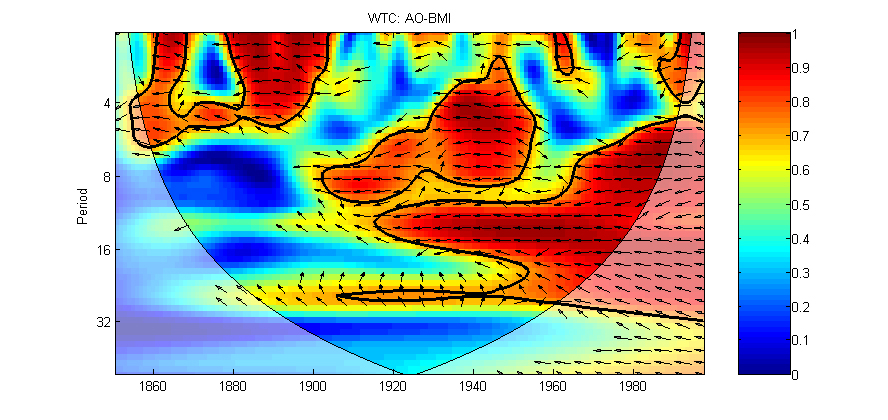
To extract even more information from our time series, we can also calculate their squared wavelet coherence transformation, shown here. Squared wavelet coherence illustrates when time series co-vary in frequency space. Just as in the cross-wavelet transform, the abscissa, ordinate, and arrows have the same properties, however, here the color gradient shows the magnitude of coherence between periodic components of these time series, rather than spectral power.
Examining both cross-wavelet and squared wavelet coherence allows for deep analysis of periodic components of time series, and can provide powerful tools when understanding shared spectral power and coherence between time series is important for understanding a phenomena or for predictive modeling and forecasting.
This analysis was based on published analyses by Grinsted, Moore, and Jevrejeva.
